Voice & Video Flow Visualizer
The Flow Visualizer can be accessed by either double-clicking on a call in the Calls view or a media flow in the Media view; or by right-clicking a call in the Calls view or a media flow in the Media view and selecting Voice & Video Flow Visualizer. The Flow Visualizer contains the Signaling and RTP tab described below.
Signaling tab
The Signaling tab of the Voice & Video Flow Visualizer displays each individual packet of an entire call within a single window, as well as the RTP packet timing, jitter, and quality score over time. If there are gaps of missing or late RTP packets, these gaps are also displayed, along with their effect on call quality. Signaling and media stream packets are represented by horizontal lines, giving you an immediate overview of the contents of a call. The bounce diagram also includes linear representations as well as numerical measurements of quality and jitter values.
In addition to displaying many of the same columns available in the Calls and Media views, the Voice & Video Flow Visualizer contains columns that allow you to calculate the relative time lapse between individual packets, the signaling sequence method of the call, and more (see Voice & Video Flow Visualizer columns).
NOTE: The Voice & Video Flow Visualizer displays only calls, not individual media flows. Opening a Voice & Video Flow Visualizer window for one or more media flows is the same as opening their corresponding calls.
Additionally, if any of the packets of a call are missing (because the packets have wrapped out of the capture buffer), the Signaling and RTP tabs in the Voice & Video Flow Visualizer will not populate.
Additionally, if any of the packets of a call are missing (because the packets have wrapped out of the capture buffer), the Signaling and RTP tabs in the Voice & Video Flow Visualizer will not populate.
To view the Voice & Video Flow Visualizer:
1. Select one or more calls or media flows in the Calls or Media views of a capture window.
2. Right-click and choose Flow Visualizer. The Signaling tab for this call or calls appears.
The parts of the Signaling tab are described below.
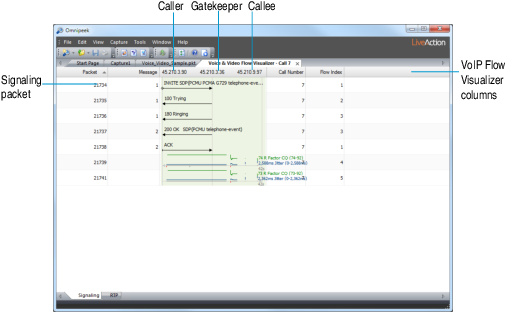
• Nodes: Each node participating in the call gets a vertical line, with the caller usually on the left, the gatekeeper in the middle, and callee on the right.
• Signaling packets:
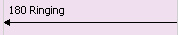
• Each signaling packet appears as a black horizontal arrow, with a summary above the arrow:
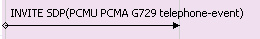
• Packets that start a call (such as SIP INVITE packets) start with a small diamond:
• Packets that usually mean the end of call setup (such as SIP ACK packets) start with a small bar. The time between these two packets is the call setup time.
• RTP/RTCP packets: RTP/RTCP media packets appear as horizontal light grey arrows, with a green R-Factor and blue jitter line graph above the arrow. See RTP/RTCP Rows.
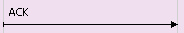
• Voice & Video Flow Visualizer columns: Right-click the column header to display available columns. For example, selecting displays the time elapsed since the start of the call and the individual signaling and RTP media packets:
For a complete list and description of Voice & Video Flow Visualizer columns, see Voice & Video Flow Visualizer columns.
• Right-click options:
• Go To Packet: Show a selected packet in the Packets view and bring Packets view to front.
• Decode Packet: Open a decode window for the selected packet.
• Select Related Packets:
• By Call: All signaling, media, and media control packets for the selected call
• By Source: All packets to or from the source IP address.
• By Destination: All packets to or from the destination IP address.
• By RTP/RTCP Packets: All packets in the RTP/RTCP row.
See Selecting related packets for more information about using this feature.
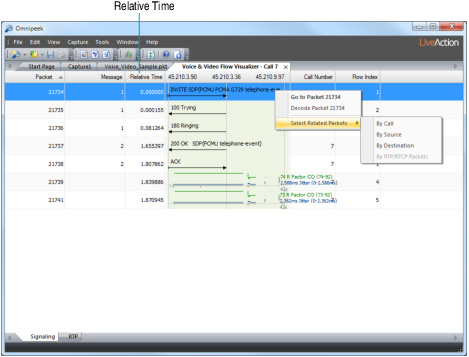
• Call background color: Each call gets its own background color in the bounce diagram, making it possible to follow several simultaneous calls within a single window:
RTP/RTCP Rows
The media or voice streams (RTP/RTCP packets) within a call display in the Signaling tab as rows progressing through time, with the first packet in the row at the left to the last packet at the right. Since most calls are bidirectional, a pair of rows often appears with one row for each direction.
The parts of the RTP/RTCP media packets in a bidirectional call are identified below.
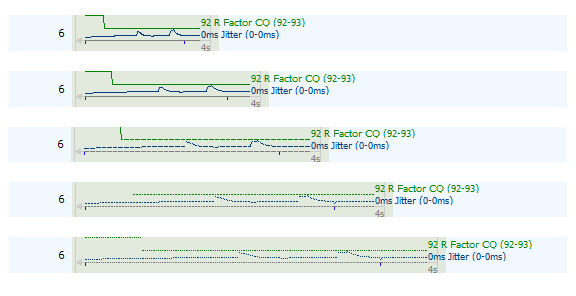
• Grey arrows and numbers: Grey horizontal arrows represent the RTP/RTCP media packets. The last packet in the row displays a small grey number showing the entire duration for the row. (Trivial durations are not shown for very brief rows.)
• Green lines and numbers: Green horizontal lines show R-Factor conversational values, with the row’s final value and minimum-maximum range in green to the right of the last packet in the row.
• Blue lines and numbers: Blue lines show jitter values, with the row’s final value and minimum-maximum range in blue to the right of the last packet in the row.
• Blue tick marks: Blue tick marks represent RTCP packets.
• Grey tick marks: Grey tick marks represent out-of-sequence RTP packets.
• Red tick mark: Red tick marks show gaps of one or more missing packets.
NOTE: Gaps where no packets appear are readily visible, as well as their immediate effects of lowering R-Factor and raising jitter values.
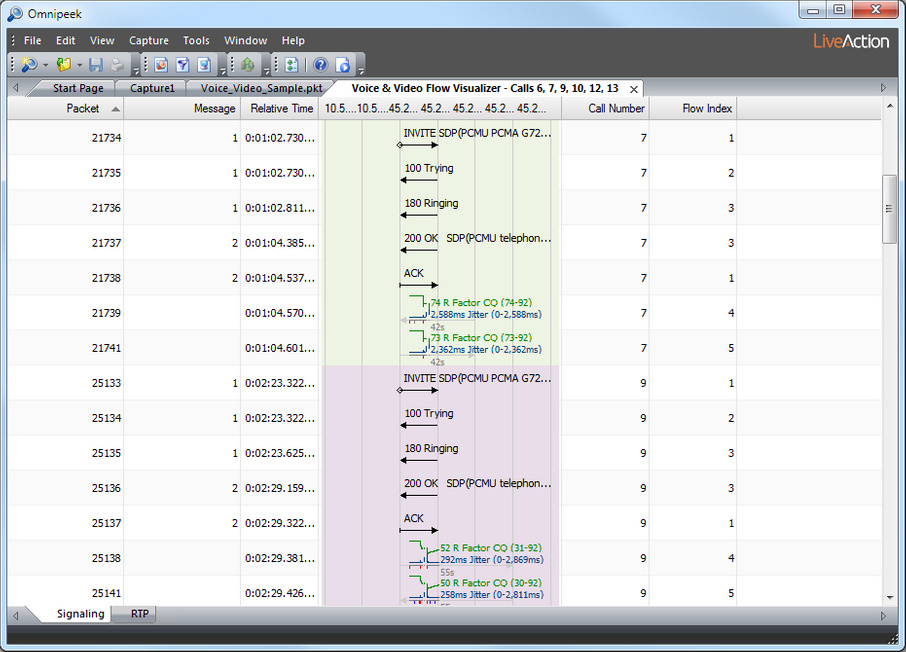
As you widen the bounce diagram column, the Voice & Video Flow Visualizer can break an RTP line into its individual packets, as shown below:
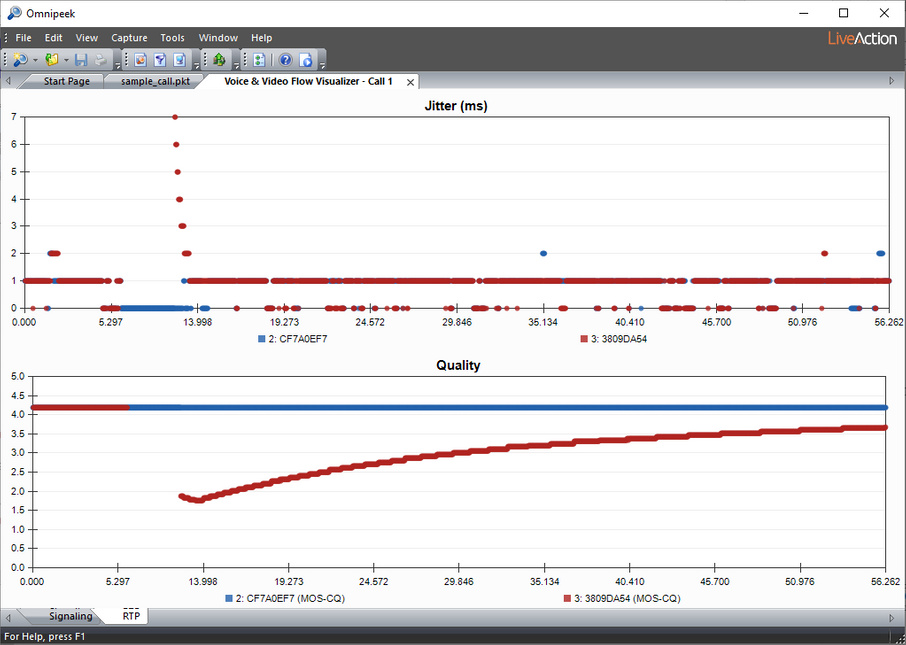
RTP tab
The RTP tab of the Voice & Video Flow Visualizer window displays jitter (ms) and quality graphs of the selected calls in the Call or Media views. The legend in each of the graphs displays a unique Flow Index followed by the SSRC for the call (for example 3: 3809DA54).